Case Study: Monitoring Heap Histogram
WARP includes a HeapHistogramCollector that can be used to monitor the effects of an experiment on the heap.
We use the attach API to sample the heap histogram, and write the resulting data to InfluxDB. Grafana can be used to visualize the heap measurements.
The HeapHistogramCollector comes in two variants: “continuous” and “bracketed”. The continuous
version uses a separate thread to sample the heap at regularly specified intervals, while
the bracketed version takes a heap sample before and after an experimental test.
Both versions support the -live flag, controlling whether or not GC should be invoked prior to sampling the heap.
Using this option ensures that only live, uncollectible objects on the heap are sampled.
The data sampled by this collector is equivalent to that obtained by running jmap -histo <pid>, and
will be similar to this example:
num   #instances    #bytes  class name
--------------------------------------
  1:      1414     6013016  [I
  2:       793      482888  [B
  3:      2502      334928  <constMethodKlass>
  4:       280      274976  <instanceKlassKlass>
  5:       324      227152  [D
  6:      2502      200896  <methodKlass>
  7:      2094      187496  [C
  8:       280      172248  <constantPoolKlass>
  9:      3767      139000  [Ljava.lang.Object;
 10:       260      122416  <constantPoolCacheKlass>
 11:      3304      112864  <symbolKlass>
 12:       160       72960  java2d.Tools$3
 13:       192       61440  <objArrayKlassKlass>
 14:       219       55640  [F
 15:      2114       50736  java.lang.String
 16:      2079       49896  java.util.HashMap$Entry
 17:       528       48344  [S
 18:      1940       46560  java.util.Hashtable$Entry
 19:       481       46176  java.lang.Class
 20:        92       43424  javax.swing.plaf.metal.MetalScrollButton
Further information on jmap and the histo operation can be perused here
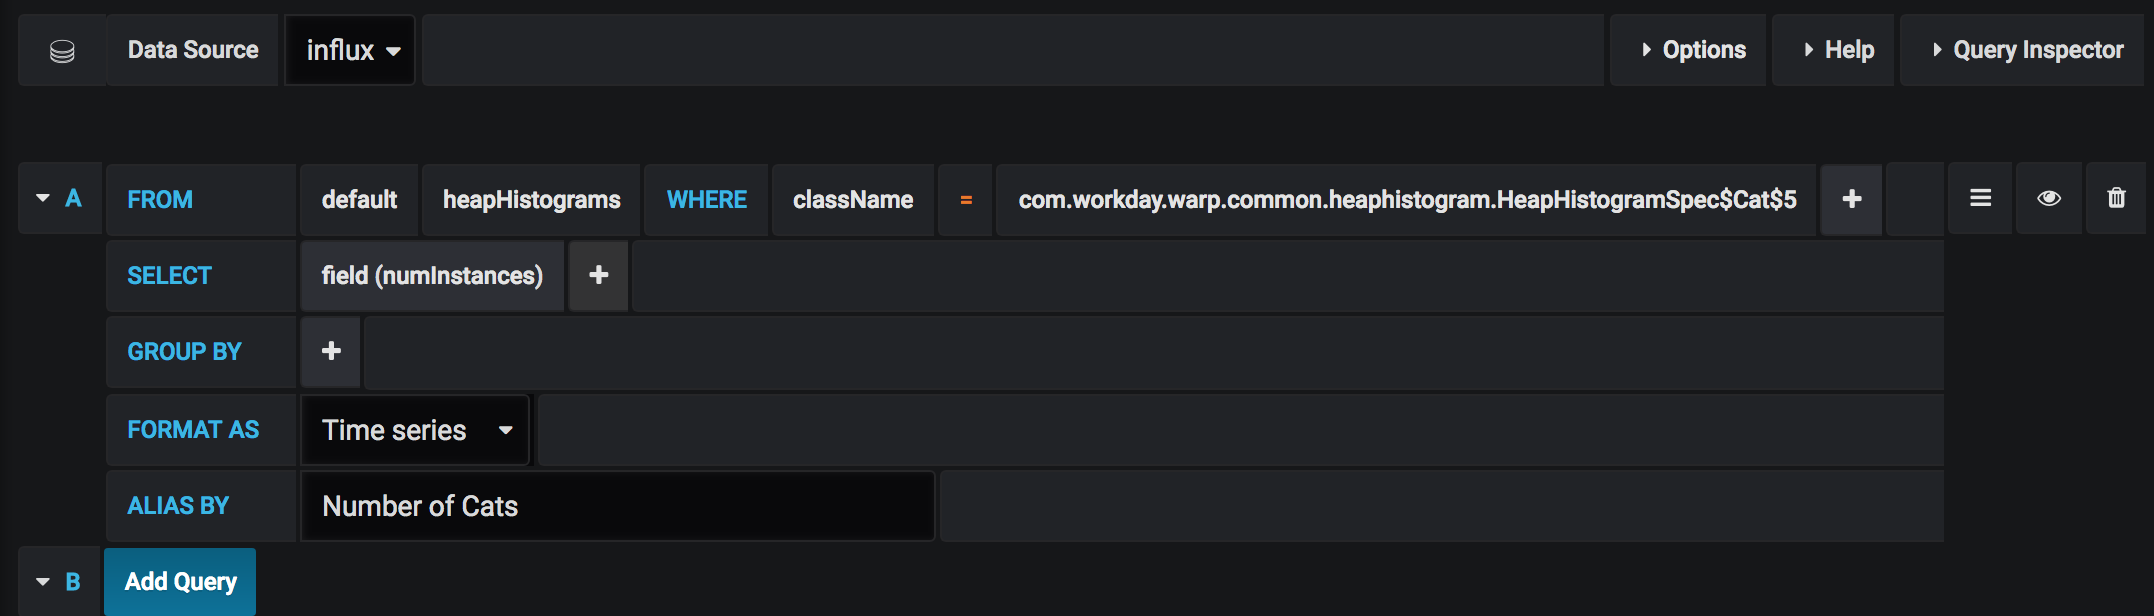
Here are some results from using the continuous variant of the HeapHistogramCollector in order to view the number of Cats on the heap in Grafana. Note: byte usage on the heap is also recorded, but this Grafana query only displays the number of instances.
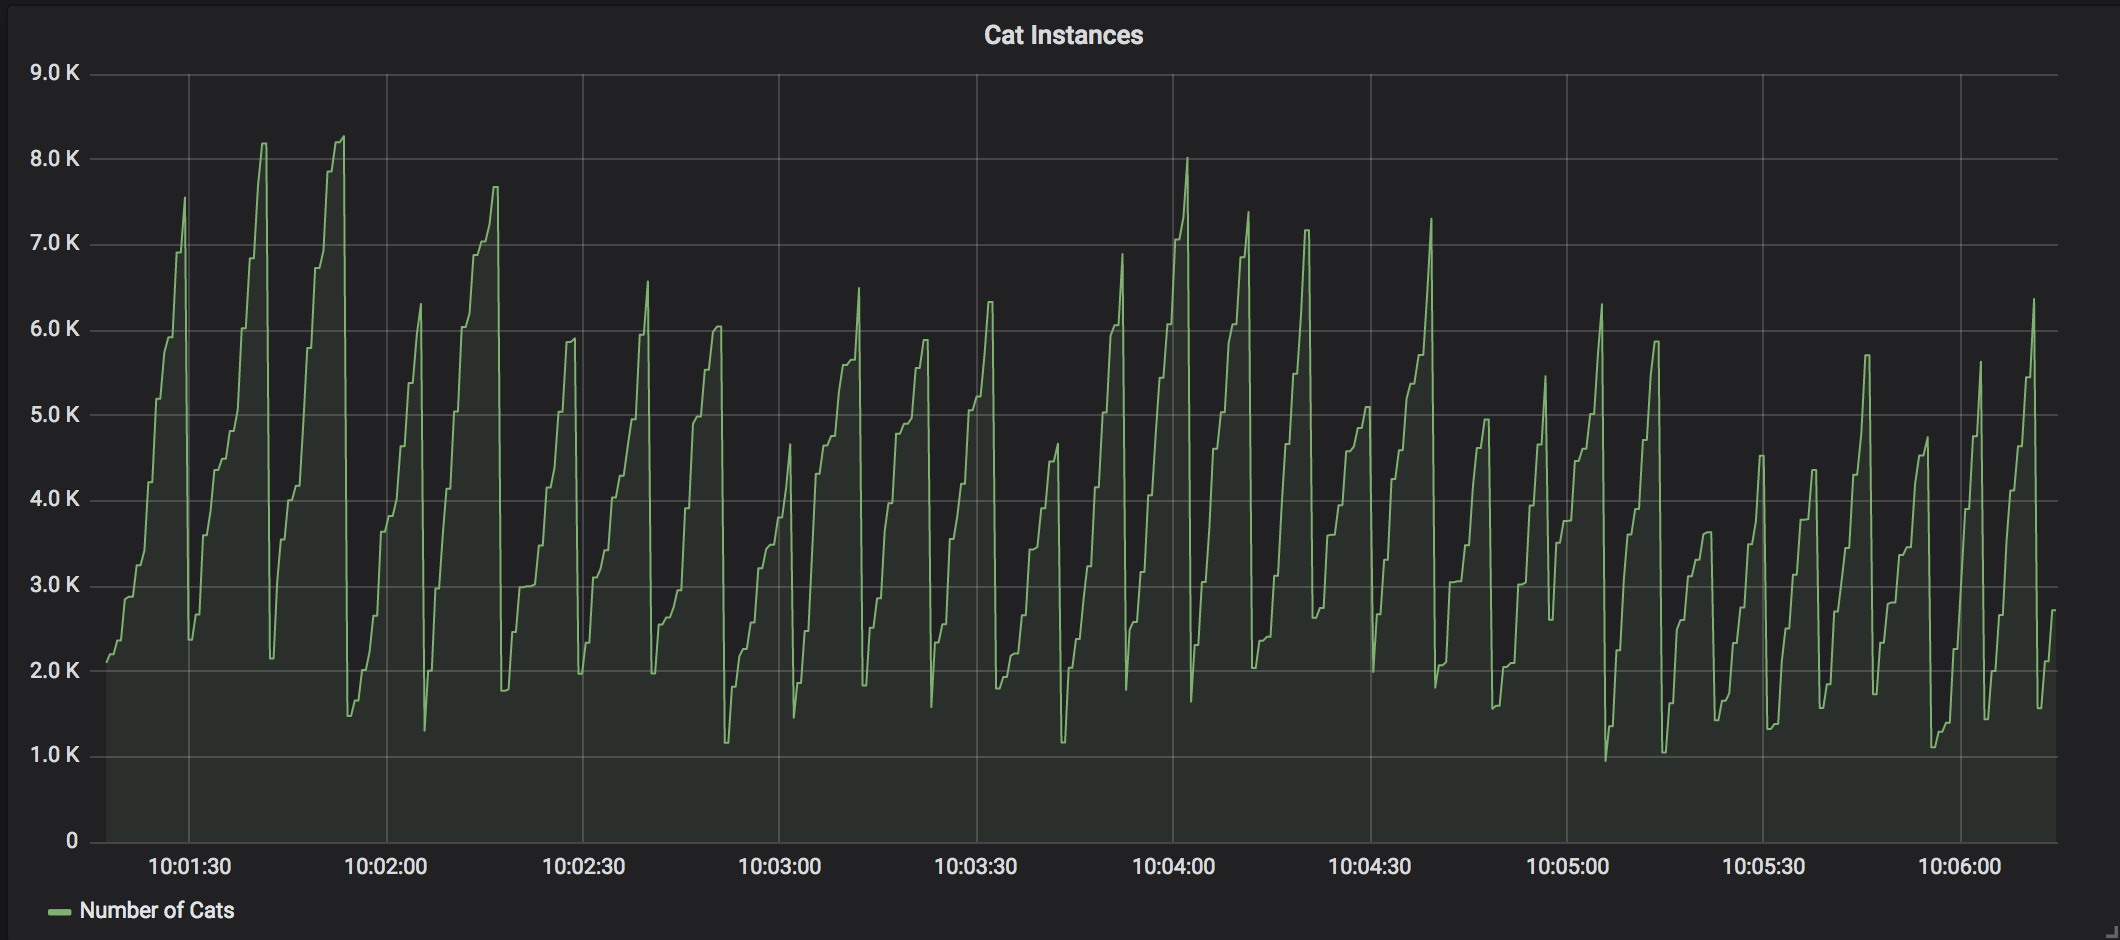
This data was generated by the following test:
- Instantiate a
MeasurementCollectionControllerand aContinuousHeapHistogramCollector - Register the Collector to the Controller
- Begin collection
- Periodically populate a
List[Cat]with a random number of Cats and sleep - End collection
|
|
That graph was exposed using this Query on the Grafana Query Builder: